
Best Nordic Country to Live In 2026: Evidence-Based Comparison
Compare Norway, Denmark, Sweden, Finland and Iceland with 2025–2026 evidence on prices, tax, work hours, jobs, housing and family life—then choose by your own priority.
Researched and updated by Nordic Life Guide Research Desk
Quick answer
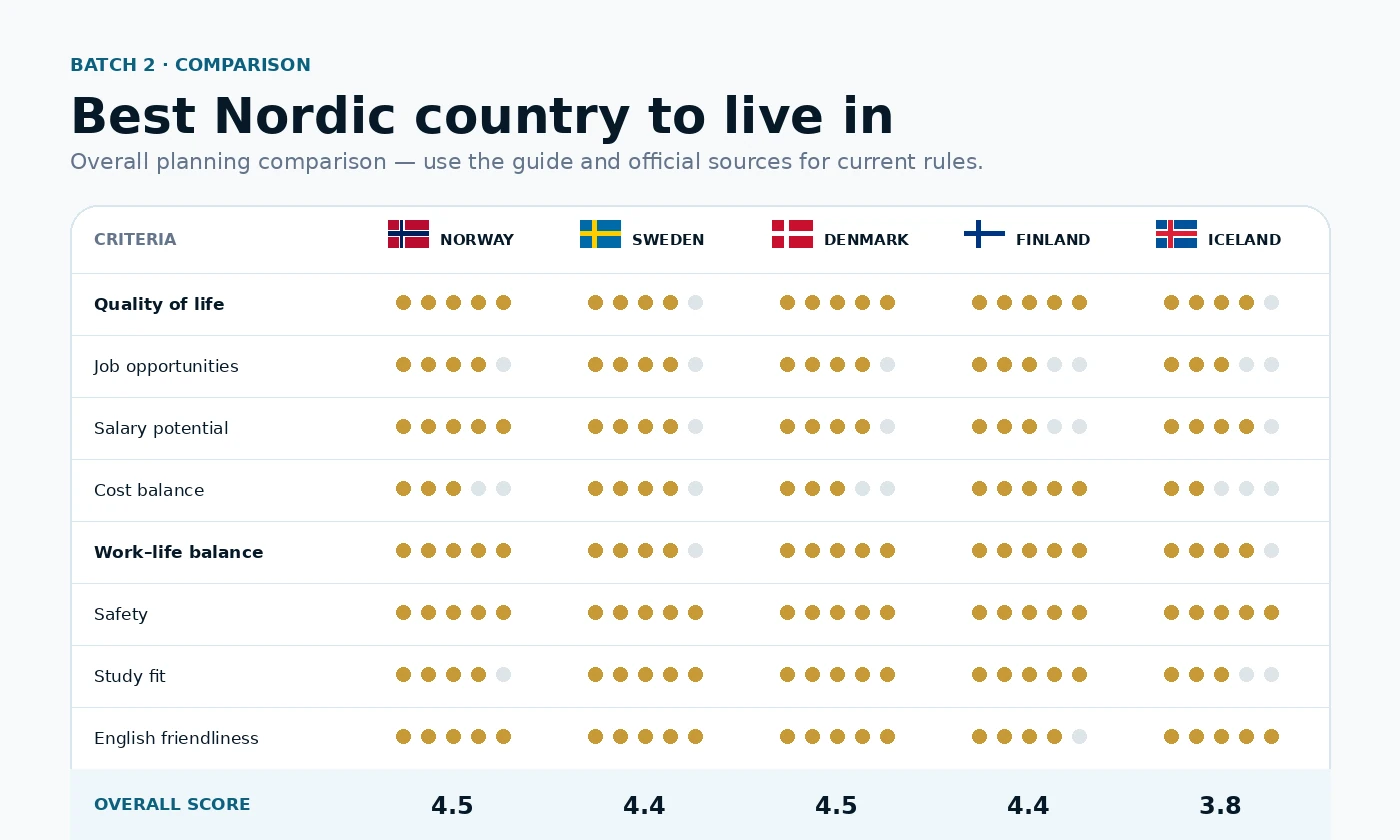
There is no evidence-based single winner for everyone. Norway currently has the strongest broad labour-market signal of the five and high salary potential; Denmark combines very low average annual work hours with strong family/work systems but unusually high housing pressure; Sweden offers scale and international employers with mid-range Nordic prices; Finland has the lowest 2025 consumer price level in this five-country dataset but the highest current unemployment among the four May 2026 values; Iceland has the highest consumer price level and a small labour market but a distinctive lifestyle and parental-leave structure. Use the data to eliminate weak fits, then compare the two finalist cities with your real job, tax, housing and residence route.
Updated: 2026-08-17
Sources checked: 2026-08-17
On this page
- How to use this comparison without creating a fake 'best country' score
- For work: Norway is the strongest first labour-market check, but occupation can reverse the result
- For money: Finland is cheapest in the national price basket, but tax and salary change the result
- For work-life and families: Denmark, Sweden, Iceland and Norway lead different dimensions
- For English speakers: measure job access by occupation, not national English proficiency
- The final decision is country → city → offer/route, in that order
What to know first
- Do not use one composite 'happiness' score to choose where to live.
- Use comparable data only where the definitions match: price level, OECD tax wedge, OECD hours and Eurostat unemployment.
- Then switch to occupation, city, family and residence-route evidence where national averages stop being useful.
- The best country is the one where legal route + credible job/study plan + housing + household budget all work together.
Before you decide
Use this guide for the right situation
Who this guide is for
Workers, students and families comparing all five Nordic countries.
What it covers
Evidence-led shortlist using prices, tax, labour market, work-life, housing and family factors before city-level verification.
Also check separately
Next step: Pick the two strongest countries for your priority, then use the specialist comparison pages and a real city/job/budget test.
Key facts
Key facts used in this guide
- Highest housing pressure signal
- Denmark
23% city overburden; 26% disposable-income share in 2024
Comparable Nordic benchmark
2025 household-consumption price levels
For cross-country comparisons, a single harmonised dataset is more useful than mixing unrelated cost-of-living websites. Eurostat's 2025 price-level index sets the EU average at 100. It describes broad national consumer prices, not your personal rent or monthly budget.
| Country | Index (EU=100) | What it means |
|---|---|---|
| Finland | 126.1 | Above 100 means the broad household-consumption price level was above the EU average. |
| Sweden | 128.4 | Above 100 means the broad household-consumption price level was above the EU average. |
| Norway | 138.4 | Above 100 means the broad household-consumption price level was above the EU average. |
| Denmark | 140.2 | Above 100 means the broad household-consumption price level was above the EU average. |
| Iceland | 183.7 | Above 100 means the broad household-consumption price level was above the EU average. |
Eurostat — Comparative price levels in Europe, 2025 ↗ · 2025 reference period · checked 8 August 2026.
2025 comparison data
A comparable price baseline across all five countries
The table uses Eurostat’s 2025 price-level index for household final consumption expenditure. EU=100. It is a country-level price comparison, not a personal monthly budget or a salary-adjusted affordability score.
| Country | 2025 price level | Price rank | Strong starting point for |
|---|---|---|---|
| Finland | 126.1 | #1 of 5 | Lowest national price level in this five-country Eurostat comparison |
| Sweden | 128.4 | #2 of 5 | Second-lowest price level in this five-country baseline |
| Norway | 138.4 | #3 of 5 | Lowest broad unemployment rate in this five-country snapshot |
| Denmark | 140.2 | #4 of 5 | Lowest annual-hours measure in the five-country OECD comparison |
| Iceland | 183.7 | #5 of 5 | Relatively low broad unemployment in the latest comparable release |
Source and period: Eurostat — Comparative price levels in Europe, 2025 ↗ · 2025 · checked 2026-08-17. The ranking above is price-level order only.
Comparable evidence
Five signals to compare before choosing a Nordic country
Price level uses Eurostat 2025 household-consumption price indices (EU=100). Tax wedge is OECD's 2025 standardized single-worker-at-average-wage measure, not personal income tax. Annual hours are OECD 2025 averages. Unemployment is Eurostat May 2026 except Iceland, where April 2026 is the latest value in that release. These measures answer different questions and should not be collapsed into one fake 'best country' score.
| Country | Price level | Tax wedge | Hours/year | Unemployment | Decision use |
|---|---|---|---|---|---|
| Norway | 138.4 | 36.4% | 1,386 | 4.7% (May) | Strong labour-market signal, but price pressure remains high. |
| Denmark | 140.2 | 35.8% | 1,369 | 6.9% (May) | Very short average hours; housing pressure can be the decisive trade-off. |
| Sweden | 128.4 | 41.1% | 1,421 | 8.7% (May) | Lower price level than Norway/Denmark, but labour-market fit is more occupation-sensitive. |
| Finland | 126.1 | 42.5% | 1,492 | 10.6% (May) | Lowest price level in the five-country dataset, but current unemployment is the highest of the four May values. |
| Iceland | 183.7 | 31.5% | 1,421 | 5.8% (Apr) | Highest consumer price level; small-market fit matters more than the headline tax wedge. |
Primary sources: Eurostat — Comparative price levels in Europe, 2025 ↗ · OECD — Taxing Wages 2026 ↗ · OECD — Average annual hours actually worked per worker ↗ · Eurostat — Unemployment, May 2026 ↗
What our data shows
Nordic Life Guide analysis
Finland is the lowest-price country in our five-country 2025 price baseline at 126.1 with EU=100. Under the Nordic Life Guide Budget-First Fit profile, Finland is the first shortlist; other profiles can produce a different answer.
Supporting data: Nordic Cost Pressure Baseline 2025.
Quick comparison
The main trade-offs
How to use this comparison without creating a fake 'best country' score
The five countries can be compared with standardized data on some dimensions, but not all. Eurostat's household-consumption price level, OECD's tax wedge and annual-hours data, and Eurostat unemployment are comparable enough to show broad trade-offs. Immigration eligibility, English job access, rent for a specific home and family benefits depend on personal or local conditions and should not be forced into one numerical score.
Use the table above to identify where a country is structurally strong or weak. Then use specialist pages for jobs, taxes, housing, family and work permits before making the final city-level decision.
Evidence for this section: Eurostat — Comparative price levels in Europe, 2025 ↗ · OECD — Taxing Wages 2026 ↗ · OECD — Average annual hours actually worked per worker ↗ · Eurostat — Unemployment, May 2026 ↗
For work: Norway is the strongest first labour-market check, but occupation can reverse the result
Eurostat's May 2026 unemployment comparison is 4.7% for Norway, 6.9% Denmark, 8.7% Sweden and 10.6% Finland; Iceland's latest value in that release is 5.8% for April. NAV also estimates Norway is short about 34,000 workers in 2026, while Denmark's July Positive Lists identify 164 higher-education and 63 skilled-work titles.
Those signals make Norway and Denmark strong first checks for many workers, but they do not replace occupation-level evidence. Sweden may be stronger for a specific international tech role, Finland for a specialist employer, and Iceland for a narrow sector.
Evidence for this section: Eurostat — Unemployment, May 2026 ↗ · NAV — Employer survey 2026: labour shortage ↗ · SIRI / New to Denmark — Positive Lists updated 1 July 2026 ↗

For money: Finland is cheapest in the national price basket, but tax and salary change the result
Eurostat's 2025 price levels are 126.1 Finland, 128.4 Sweden, 138.4 Norway, 140.2 Denmark and 183.7 Iceland with EU=100. OECD's standardized single-worker tax wedge goes in a different order: 31.5% Iceland, 35.8% Denmark, 36.4% Norway, 41.1% Sweden and 42.5% Finland.
Neither ranking tells you where you will save more. Compare the actual occupation salary after tax with city housing. A higher-cost Norway offer can leave more monthly margin than a lower-cost Finland offer; the reverse can also be true.
Evidence for this section: Eurostat — Comparative price levels in Europe, 2025 ↗ · OECD — Taxing Wages 2026 ↗
For work-life and families: Denmark, Sweden, Iceland and Norway lead different dimensions
OECD's 2025 annual-hours data put Denmark lowest among the five at 1,369 hours, then Norway at 1,386. The Nordic Council of Ministers' parental-leave comparison gives Sweden the longest total leave period and Iceland the longest non-transferable quota per parent.
Denmark's work-life strengths have a housing trade-off: Eurostat reports very high Danish housing-cost pressure. A family should therefore compare leave + childcare + housing + both careers rather than 'family friendly' reputation.
Evidence for this section: OECD — Average annual hours actually worked per worker ↗ · Nordic Council of Ministers — Paid parental leave and social sustainability in the Nordic countries ↗ · Eurostat — Housing in Europe 2025 ↗
For English speakers: measure job access by occupation, not national English proficiency
High English proficiency in society does not mean every labour market works in English. Healthcare, schools, government, customer-facing work and regulated professions can require local language even when daily life is easy in English.
Use official vacancy portals and record how often your real occupation lists English, the local language, recognition and salary. Norway's Arbeidsplassen has a working-language filter; Sweden, Denmark and Finland require similarly occupation-specific searches.
Evidence for this section:
The final decision is country → city → offer/route, in that order
Shortlist two countries from the structural evidence. Choose one realistic city in each based on your job or programme. Then compare the actual offer/programme, residence route, after-tax household income, housing, commute and first-month setup.
If one country wins only because of a generic national ranking but loses on your legal route, job probability or household budget, it is not the better choice for you.
- Shortlist 2 countries
- Choose 1 realistic city in each
- Test occupation/programme
- Verify residence route
- Calculate net pay + housing
- Check first 30 days
Still comparing?
Find a better country shortlist.
Use the quiz to narrow your research, then compare the result with the guides and current sources.
Nordic Life Guide Fit Index
The evidence shortlist changes when the weights change
Skilled-worker evidence profile
Norway, then Denmark
This profile gives most weight to the latest broad labour-market signal, then national price pressure and average annual hours. It still cannot know whether your occupation, language profile, salary or permit route fits the top country.
Student evidence profile
Sweden, then Norway
This profile prioritises national cost pressure and uses labour-market and working-time data only as secondary context. Programme quality, tuition status, admissions and city housing must be checked separately.
Family evidence profile
Norway, then Denmark
This profile gives more weight to lower average annual hours and cost pressure, with broad labour-market context as a smaller input. Childcare, parental benefits, school needs and housing are not collapsed into the score.
Budget-first evidence profile
Finland, then Sweden
This profile deliberately gives most weight to the comparable 2025 Eurostat price-level index. A lower national price level does not guarantee cheaper housing or a better household budget in your chosen city.
How this comparison is weighted
These are transparent evidence profiles, not government rankings. The score uses only comparable national price-level, unemployment and average-working-hours evidence; visas, language, salary, housing and other personal factors stay outside the score. View the full method.
Useful tools
Try the numbers or checklist yourself.
Comparison
Nordic Country Comparison Tool
Weight comparable price-level, unemployment and annual-hours evidence across Norway, Denmark, Sweden, Finland and Iceland, then use the result as a shortlist before checking visas, jobs, housing and city costs.
Comparison
Best Nordic Country Quiz: Find Your Best Fit for Work, Study or Life
Choose a planning profile and transparent evidence weights to shortlist Nordic countries using comparable price-level, unemployment and annual-hours data, then verify legal, job, housing and city factors separately.
Cost of living
Nordic Cost of Living Comparison Tool (2026)
Compare Norway, Denmark, Sweden, Finland and Iceland using Eurostat's 2025 household-consumption price-level index, with a transparent reference-budget scaling tool.
Salary
Nordic Job Offer Affordability Calculator
Test a Nordic job offer against net pay, rent, essential costs and a configurable cost-stress scenario so you can see whether the move still works when expenses run above plan.
FAQ
Frequently asked questions
What is the best Nordic country to live in in 2026?
There is no single winner. Norway currently has the strongest broad labour-market signal, Finland the lowest national price level, Denmark the lowest average annual hours, and Sweden/Iceland lead different family-policy dimensions. Your route, city and household decide the final answer.
Which Nordic country is cheapest?
Finland has the lowest 2025 household-consumption price-level index of the five, but affordability depends on salary after tax and housing.
Which Nordic country is best for jobs?
Norway has the strongest broad current labour-market signal in the comparable data, but occupation, language and permit route can make another country better for you.
Which Nordic country is best for families?
Different systems lead different dimensions. Compare parental leave, childcare transition, housing, both adults' work and residence rights rather than choosing from a generic family ranking.
How we check this guideSources, boundaries and update checks
- Time-sensitive rules and statistics are linked to primary or official sources where available.
- Planning guidance is kept separate from legal eligibility, live availability and personal financial advice.
- Important dates and source checks are shown so you can re-verify changing information before acting.
Sources
Official and primary references
Open the references if you need to verify a rule, statistic or date before making a decision.
View 8 sources and verification dates
Official Eurostat comparison of 2025 price-level indices with EU=100.
Data period: 2025
Checked: 2026-08-12
OECD's 2026 edition provides standardized 2025 tax-wedge comparisons. For a single worker without children at the average wage, the total tax wedge was 35.8% in Denmark, 42.5% in Finland, 31.5% in Iceland, 36.4% in Norway and 41.1% in Sweden. The measure includes income tax and employee/employer social contributions relative to labour cost and is not the same as an individual's income-tax rate.
Data period: 2025 data, published 2026
Checked: 2026-08-17
OECD Data Explorer reports 2025 average annual hours actually worked per worker of 1,369 in Denmark, 1,492 in Finland, 1,421 in Iceland, 1,386 in Norway and 1,421 in Sweden. OECD cautions that hours-worked levels are better suited to analysing trends over time than precise level comparisons because national sources and methods differ.
Data period: 2025
Checked: 2026-08-17
Eurostat's 2 July 2026 release reports May unemployment rates of 6.9% for Denmark, 10.6% for Finland, 8.7% for Sweden and 4.7% for Norway. Iceland's May figure was not available in the release; April was 5.8%. Eurostat notes that trend components are used for Finland, Sweden, Iceland and Norway in this monthly release.
Data period: April-May 2026
Checked: 2026-08-17
Eurostat's 2025 housing publication uses 2024 data for several affordability indicators. It reports Denmark's housing costs at 86% above the EU average, a 23% housing-cost-overburden rate in Danish cities, and housing costs equal to 26% of disposable income in Denmark and 25% in Sweden. The overburden indicator means housing costs exceed 40% of disposable income.
Data period: 2024 data, 2025 publication
Checked: 2026-08-17
The 2025 comparative Nordic report documents the structure, eligibility, compensation and parent quotas across Denmark, Finland, Iceland, Norway and Sweden. It reports that Sweden has the longest total leave period in the five-country comparison, Iceland the longest non-transferable period reserved for each parent, and Denmark the shortest individual quota at 11 weeks. It also describes universal affordable ECEC rights after parental leave in all five countries except Iceland.
Data period: 2025 comparative report
Checked: 2026-08-17
NAV's 2026 employer survey estimates a national labour shortage of about 34,000 people. Health, care and nursing occupations account for the largest occupational shortage, and trade-certificate occupations also show substantial unmet demand.
Data period: Survey fieldwork January–March 2026; published 20 May 2026
Checked: 2026-08-12
The Positive List for People with a Higher Education contains 164 job titles and the Positive List for Skilled Work contains 63 job titles from 1 July 2026. Inclusion on a list is not a job offer and applicants still need to meet the route requirements.
Data period: Lists effective 1 July 2026
Checked: 2026-08-12
Read next
Continue your research
Nordic Job Market Comparison 2026: Jobs, Unemployment, Shortages & Permits
Compare Norway, Denmark, Sweden, Finland and Iceland using current unemployment data, official shortage signals, job portals, language and permit reality.
Nordic Tax Comparison 2026: Norway vs Sweden vs Denmark vs Finland vs Iceland
Compare Nordic taxes without the misleading 'highest tax' shortcut: income tax, social charges, VAT context, salary take-home and what workers should check country by country.
Nordic Work-Life Balance Comparison 2026: Hours, Leave & Daily Reality
Compare Denmark, Norway, Sweden, Finland and Iceland using 2025 work-hours data, parental-leave structure and the daily trade-offs that affect real work-life balance.
Nordic Housing Affordability 2026: Rent vs Salary in Major Cities
Compare Nordic housing affordability through rent-to-income pressure, move-in cash, city differences and the trade-off between headline salary and real housing access.
Best Nordic Country for Families 2026: Leave, Childcare, Housing & Work
Compare the five Nordic countries for family life using parental-leave design, childcare transition, housing pressure, work hours and the residence route your household actually qualifies for.
Nordic Work Permit Comparison 2026: Norway, Sweden, Denmark, Finland & Iceland
Compare Nordic work routes by citizenship, job-offer requirement, salary rules, shortage routes and the authority you must use in 2026.
Nordic Salary Comparison 2026: Compare Pay Without Misreading Averages
Compare current official salary benchmarks, then turn a real Nordic job offer into after-tax purchasing power and city affordability.
Best Nordic Country for English Speakers 2026: Jobs, Study & Daily Life
Compare English usability across Nordic countries without confusing high English proficiency with an English-language job market. Use real vacancy and occupation checks.