
Eurostat — Comparative price levels in Europe, 2025 ↗
Official Eurostat comparison of 2025 price-level indices with EU=100.
Data period: 2025
Checked: 2026-08-12
Free Nordic planning tool
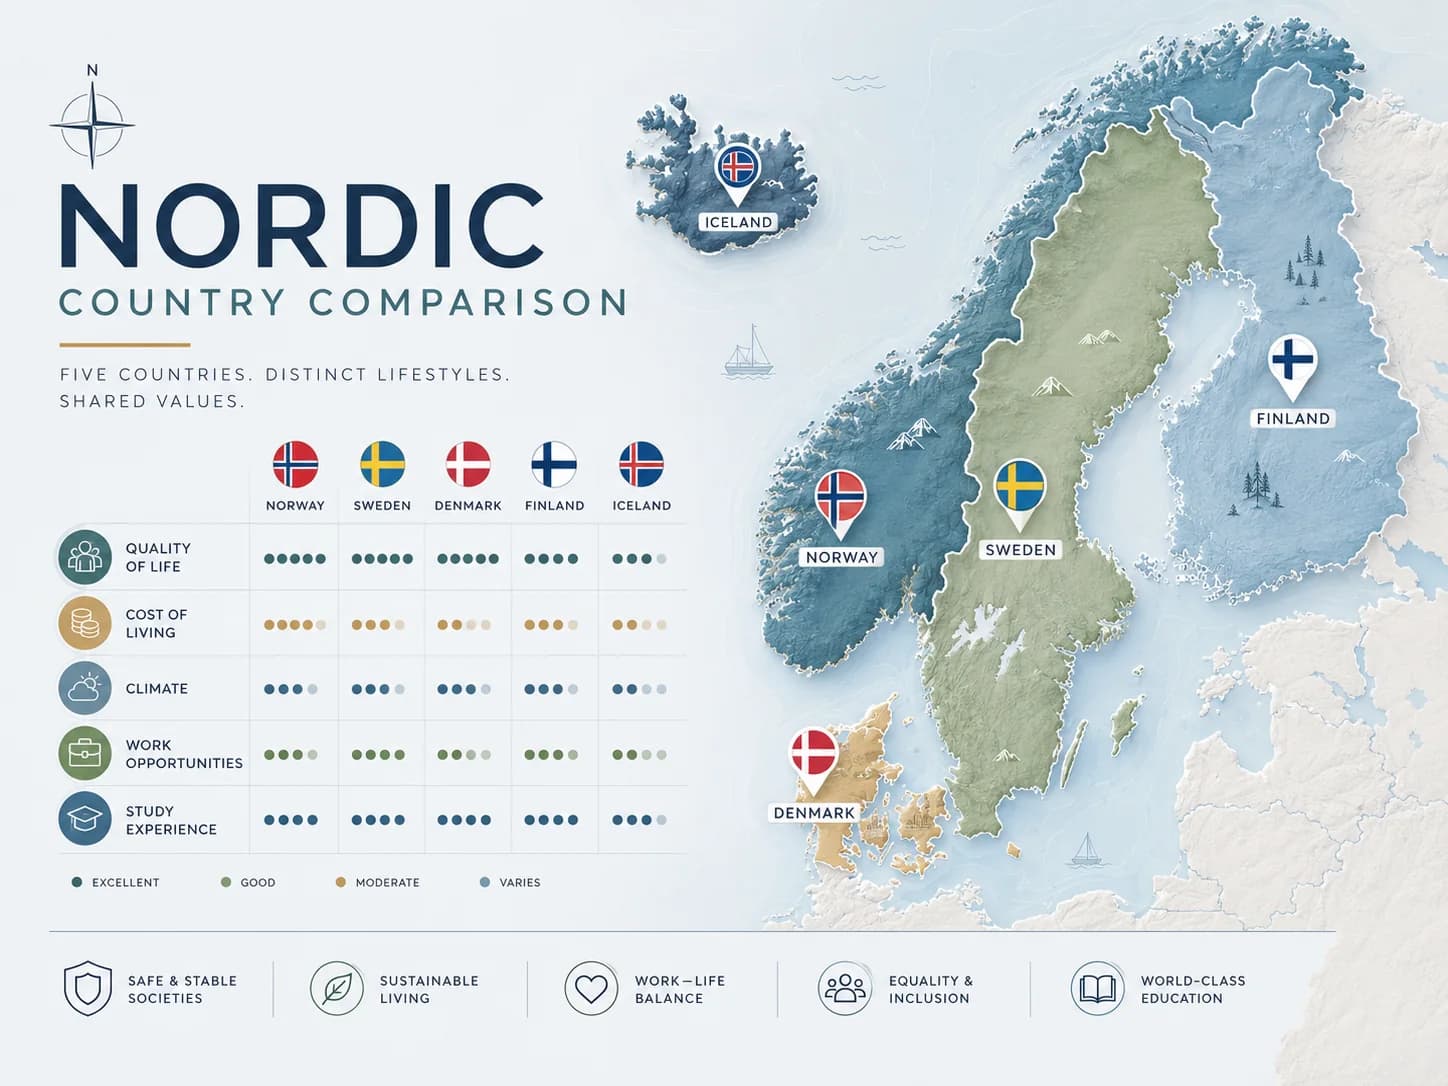
Weight comparable price-level, unemployment and annual-hours evidence across Norway, Denmark, Sweden, Finland and Iceland, then use the result as a shortlist before checking visas, jobs, housing and city costs.
Your scenario
Nothing is prefilled. Use figures from the job offer, home, institution, route or trip you are actually considering.
Question this tool answers
Which Nordic countries deserve deeper research when you weight the comparable evidence that matters most to you?
Evidence-weighted shortlist
Choose how much three comparable evidence signals matter to you. The tool uses Eurostat 2025 national price levels, the latest comparable 2026 Eurostat unemployment snapshot and OECD 2025 average annual hours. It deliberately does not invent hidden scores for language, visas, salary, housing or climate.
Your result
Choose your context and all three evidence priorities. The tool does not select a country before you provide the weights.
For each measure, the lowest value among the five countries receives the strongest relative factor score and the highest value the weakest. Your three selected weights are then normalised to 100% and combined. No undisclosed editorial points are added.
That method is intentionally narrow. National price levels do not equal your city budget; unemployment does not equal hiring probability; and average annual hours do not equal your contract. Read the full methodology and limitations.
Inputs that matter
What it does not prove
The evidence score covers only three comparable indicators. It does not hide visa eligibility, English access, salary, rent, childcare, healthcare or climate inside the number, and it cannot predict your personal outcome.
Best next step
Use the result as a filter, then verify the decision in the detailed guide and current source.
Read the full country comparison →After you calculate
01
Open the top country hub and check the legal route that applies to your nationality.
02
Compare your occupation, real salary offer and city-level housing rather than treating the national score as a verdict.
03
Inspect the raw evidence and test a second weighting before deciding which country to research first.
FAQ
Example values can make a planning tool look more precise than it is. The fields start empty so the result is based on your own offer, rent, household, route or travel assumptions. Placeholders show the expected format only and are not used in the calculation.
The evidence score covers only three comparable indicators. It does not hide visa eligibility, English access, salary, rent, childcare, healthcare or climate inside the number, and it cannot predict your personal outcome. Use the result to compare scenarios, then verify the relevant current source or detailed guide before making a financial, immigration, study, housing or travel commitment.
Sources
Open the references if you need to verify a rule, statistic or date before making a decision.
Official Eurostat comparison of 2025 price-level indices with EU=100.
Data period: 2025
Checked: 2026-08-12
Eurostat's 2 July 2026 release reports May unemployment rates of 6.9% for Denmark, 10.6% for Finland, 8.7% for Sweden and 4.7% for Norway. Iceland's May figure was not available in the release; April was 5.8%. Eurostat notes that trend components are used for Finland, Sweden, Iceland and Norway in this monthly release.
Data period: April-May 2026
Checked: 2026-08-17
OECD Data Explorer reports 2025 average annual hours actually worked per worker of 1,369 in Denmark, 1,492 in Finland, 1,421 in Iceland, 1,386 in Norway and 1,421 in Sweden. OECD cautions that hours-worked levels are better suited to analysing trends over time than precise level comparisons because national sources and methods differ.
Data period: 2025
Checked: 2026-08-17
Read next
Compare Norway, Denmark, Sweden, Finland and Iceland with 2025–2026 evidence on prices, tax, work hours, jobs, housing and family life—then choose by your own priority.
Compare Norway, Denmark, Sweden, Finland and Iceland using current unemployment data, official shortage signals, job portals, language and permit reality.
Compare Nordic housing affordability through rent-to-income pressure, move-in cash, city differences and the trade-off between headline salary and real housing access.